Ok - as requested:
Inactive users compared to registration for each year 2005 - 2010. The earlier years are somewhat advantaged by the fact that they would have been purged (we are due for another by the look of it).
For the purposes of these diagrams, inactive is defined as not having any activity since Feb 1st last year - 12 months.
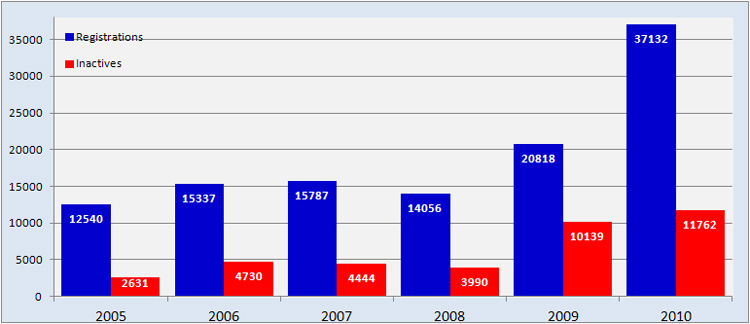

I would think the ~30% post-purge mark is about right for those early years and pre-purge it's likely to have been around the 40% mark.
2009 is now due to be purged and a dummy run of the purge shows that only about 2,300 of those 10,139 inactive users would remain (they have at least 1 post) which would leave the percentage at 37% - higher than the other years but that is expected given the changes in the viewing capability we introduced that year.
I would expect a similar (if not higher percentage) result for 2010 if we check it in a years time for much the same reason. The higher registration numbers are largely caused because people who got here via a google search in answer to a question have to register (in most cases) to view that result. Once they have that answer, clearly about half never return.
Cheers
Russ